100% area = 373538.878 sq m = 37.350 ha = 92.303 acres
95% area = 227180.747 sq m = 22.718 ha = 56.137 acres
75% area = 105854.377 sq m = 10.585 ha = 26.157 acres
50% area = 47963.514 sq m = 4.796 ha = 11.852 acres
25% area = 17174.939 sq m = 1.717 ha = 4.244 acres
Accurate Home Range calculations require the tracking and recording of location points to be consistant. Every day all season, or every 2nd day all season.
frequently visited areas
easy to access
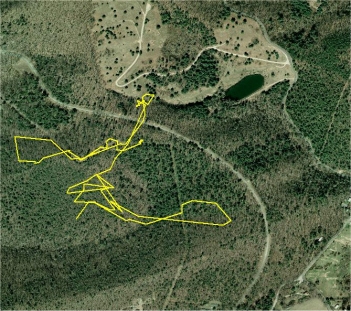
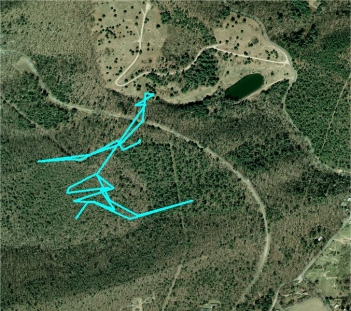
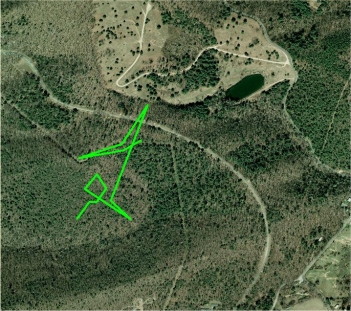
These 3 photo maps are of Turtle M1's 2013 tracked travels from emergence to hibernation.
The upper left is an as-tracked route of 87 GPS locations, 2.4 GPS miles and the upper right is the route of the 33 locations if tracked every 5 days, 1.7 miles. The lower left map shows the 14 locations if located every 14 days, and is 0.9 GPS miles in length.
The determining of a turtle's actual Primary Activity Area (Home Range) is largely dependant on the quality, intensity, and consistency of the season's tracking activity, and ultimately, multi-season tracking activity.
What M1's actual traveled route looked like is unknown, since she was not tracked daily. But having thread-trailed her many seasons in the past, the estimated travel distance for this season, might be well over 5 miles.
Turtle Tracking Precision
Turtle M1(F), all tracked GPS points 2008 to 2018
Eastern Box Turtle
Terrapene carolina carolina
Home Range vs. Activity Area
A Relict Population Doomed To Extinction?